GrADS in EES405
Introduction and setup for GrADS environment used in the course
GrADS Scripts and Plots for EES405
GrADS (Grid Analysis and Display System) is an important tool in the field of climate science and meteorology. Its robust data handling capabilities and rich suite of graphic visualizations make it an excellent resource for analyzing and displaying complex climate datasets. GrADS is particularly effective in working with gridded data, allowing for a wide range of data exploration, manipulation, and visualization techniques. These capabilities make it widely adopted in the climate science community for tasks such as creating climatological averages, anomalies, and other derived fields. In this course, we will be using GrADS to visualize various atmospheric parameters, aiding our understanding of the intricate dynamics of the Earth's climate system.
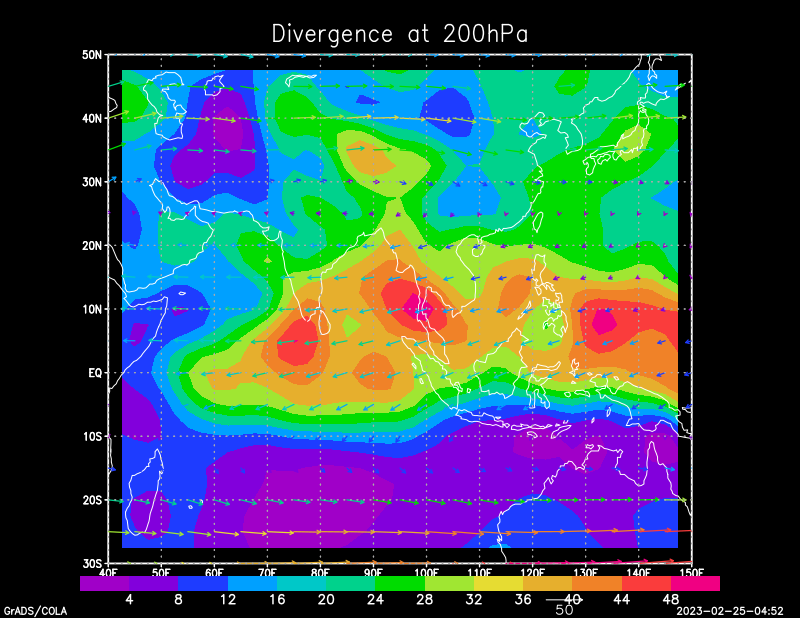
GrADS Script: Divergence
                    'reinit'
                    'sdfopen uwnd.jjas.200hpa.nc'
                    'sdfopen vwnd.jjas.200hpa.nc'
                    'set gxout shaded'
                    'd hdivg(uwnd,vwnd.2)'
                    'set gxout vector and stream'
                    'd skip(uwnd,2,2);vwnd.2;mag(uwnd,vwnd.2)'
                    'run cbar'
                    'draw title Divergence at 200hPa'
                    'printim divergence.png'
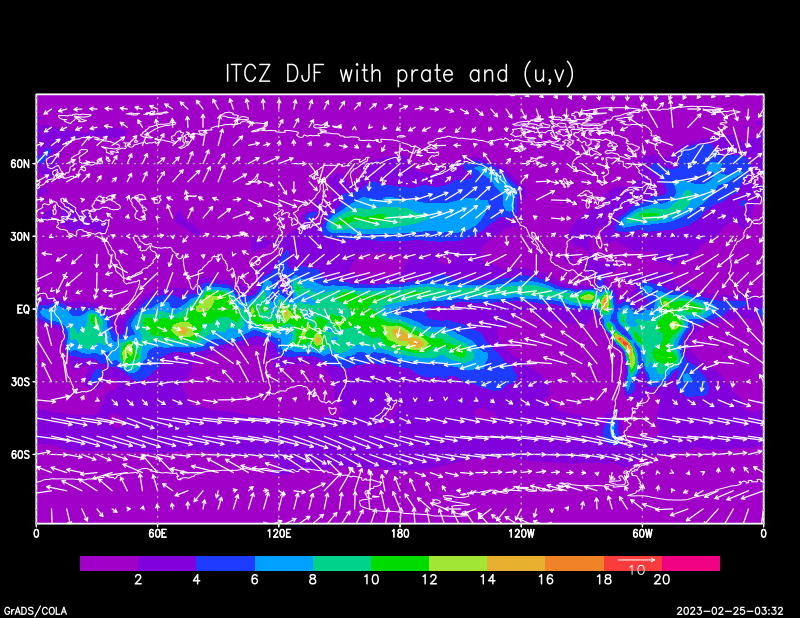
GrADS Script: ITCZ DJF
                    'reinit'
                    'sdfopen prate.1980.2020.djf.timmean.nc'
                    'set gxout shaded'
                    'a = prate*86400'
                    'd a'
                    'run cbar'
                    'sdfopen uwnd.1980.2020.djf.nc'
                    'set dfile 2'
                    'set lev 1000'
                    'sdfopen vwnd.1980.2020.djf.nc'
                    'set dfile 3'
                    'set lev 1000'
                    'd skip(uwnd.2,3,3);vwnd'
                    'draw title ITCZ DJF with prate and (u,v)'
                    'printim itcz.djf.prate.uv.png'
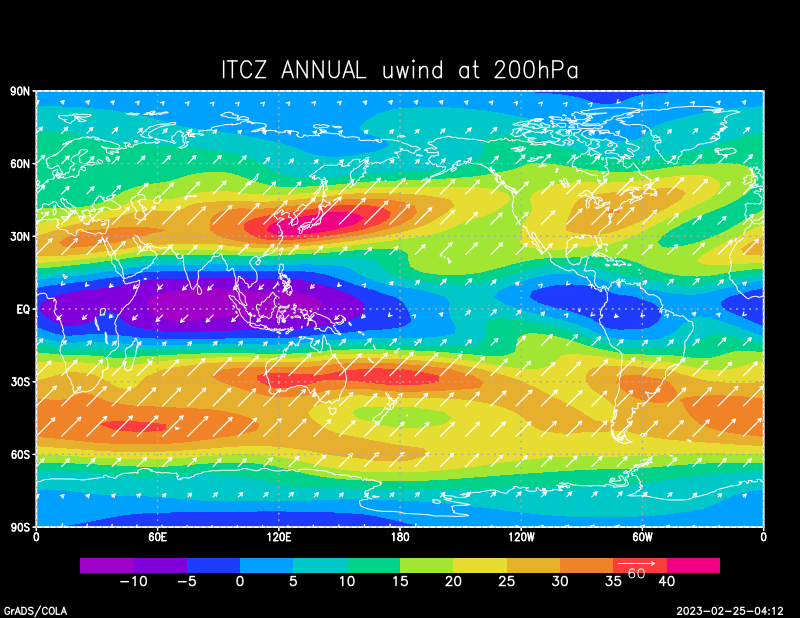
GrADS Script: U Wind at 200hPa
                    'reinit'
                    'sdfopen uwnd.annual.timmean.nc'
                    'set lev 200'
                    'set gxout shaded'
                    'd uwnd'
                    'run cbar'
                    'set gxout vector'
                    'd skip(uwnd,5,5);uwnd'
                    'draw title ITCZ ANNUAL uwind at 200hPa'
                    'printim itcz.uwnd.200hpa.png'
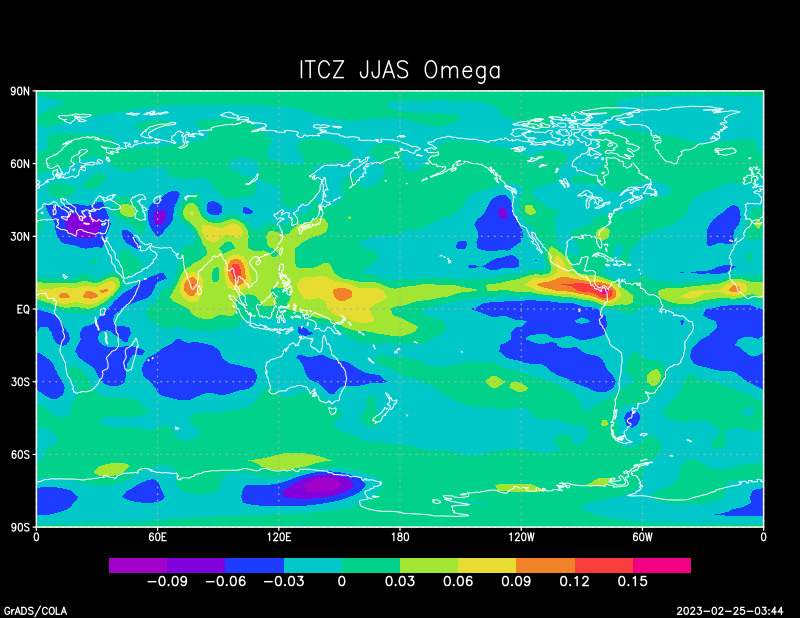
GrADS Script: Omega
                    'reinit'
                    'sdfopen omega.1980.2020.jjas.nc'
                    'set lev 500'
                    'set gxout shaded'
                    'a = -1*omega'
                    'd a'
                    'run cbar'
                    'draw title ITCZ JJAS Omega'
                    'printim itcz.jjas.omega.png'